
This was a project for GIS Visualisation course in 2019. I wrote 21 page report but this text will be a “super summary” of it with no excessive details.
Software:
- ArcGIS
- Excel
Data:
- Japan shapefiles including population data from Japanese Government Statistics Agency
- DEM 30m from USGS
- Maximum tide data from Japan Oceanographic Data Center
- Yearly average sea level anomaly data from Japan Meteorological Agency
- IPCC report
Climate change, urbanisation, and land subsidence are already affecting the lives of millions in the coastal cities by raising the sea level and increasing the risk of coastal flooding. Governments will need to take further expensive actions to secure lives to prevent coastal flooding.
Future sea levels are calculated by complex models that accounts for regional and global data such as land subsidence, land uplift, atmospheric and oceanic circulations. extreme water level etc.
In this project I used a simplified equation to predict future sea level for 2100.
WL = SLR + MT + SLA + HS
- WL = Water level
- SLR = Global mean sea level rise for 2100
- MT = Increase in the maximum tide
- SLA = Increase in mean sea level anomaly
- HS = Human-induced subsidence
Study Area 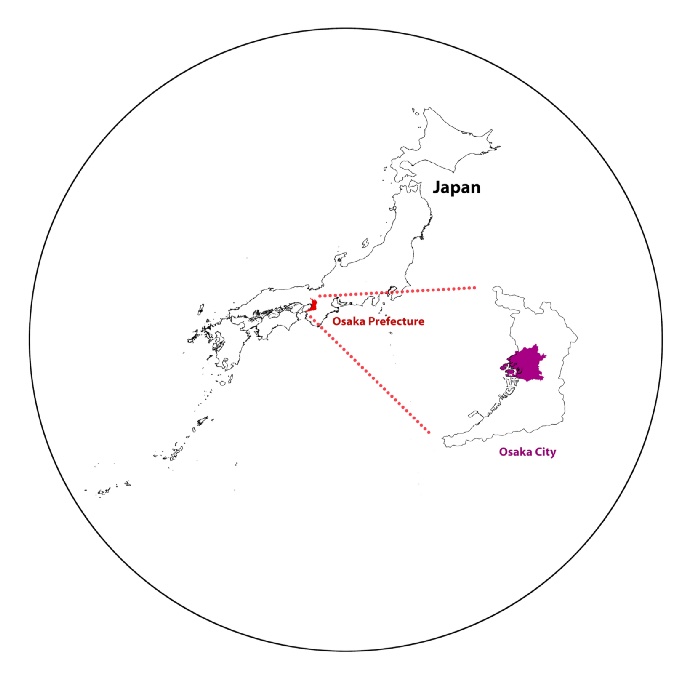
The Japan archipelago faces the Pacific Ocean to the east and the Sea of Japan to the west. It is, by nature, very vulnerable to sea level rise, land subsidence and consequently to tides and typhoons. The city of Osaka, in central Japan, is open to the Osaka Bay on the west side and it lies on a flat alluvial plain. The elevation can be as low as 1 to 3 meters in many places.
Calculating Future Sea Level in Osaka
The equation needs four parameters to be determined. The first one, global mean sea level rise (SLR), is directly acquired from the IPCC reports RPC 8.5 scenario without any further calculation.
The increase in the maximum tide (MT) is calculated using the hourly tide records dataset from JODC (Japan Oceanographic Data Center, n.d.). The records date back to 1961 and are recorded hourly until 2015. The tide level for 2100 is calculated by creating a linear trend line equation. The increase in maximum tide is then calculated by subtracting the 2100 data from 2015.
The data for yearly average sea level anomaly is taken from JMA (Japan Meteorological Agency, 2018) and dates back to 1960 and continues until 2017. The anomaly level for 2100 is calculated using a linear equation and the change (SLA) is computed by subtracting 2100 level from 2017.
The subsidence (HS) in Osaka is observed to be zero (stopped), as a result of many prevention laws, as stated in the World Bank report (EX Corporation, 1996).
Overall, the water level in Osaka in 2100 is the sum of these parameters:
WL = 0.63 + 0.7 + 0.1 + 0 = 1.43 meter
Considering the most extreme IPCC scenario, the global mean sea level predictions for 2100 is 0.63 meters (IPCC, 2015). So my simplistic formula seems way too off. But nevertheless I will compute the submerged areas assuming this water level.
Results 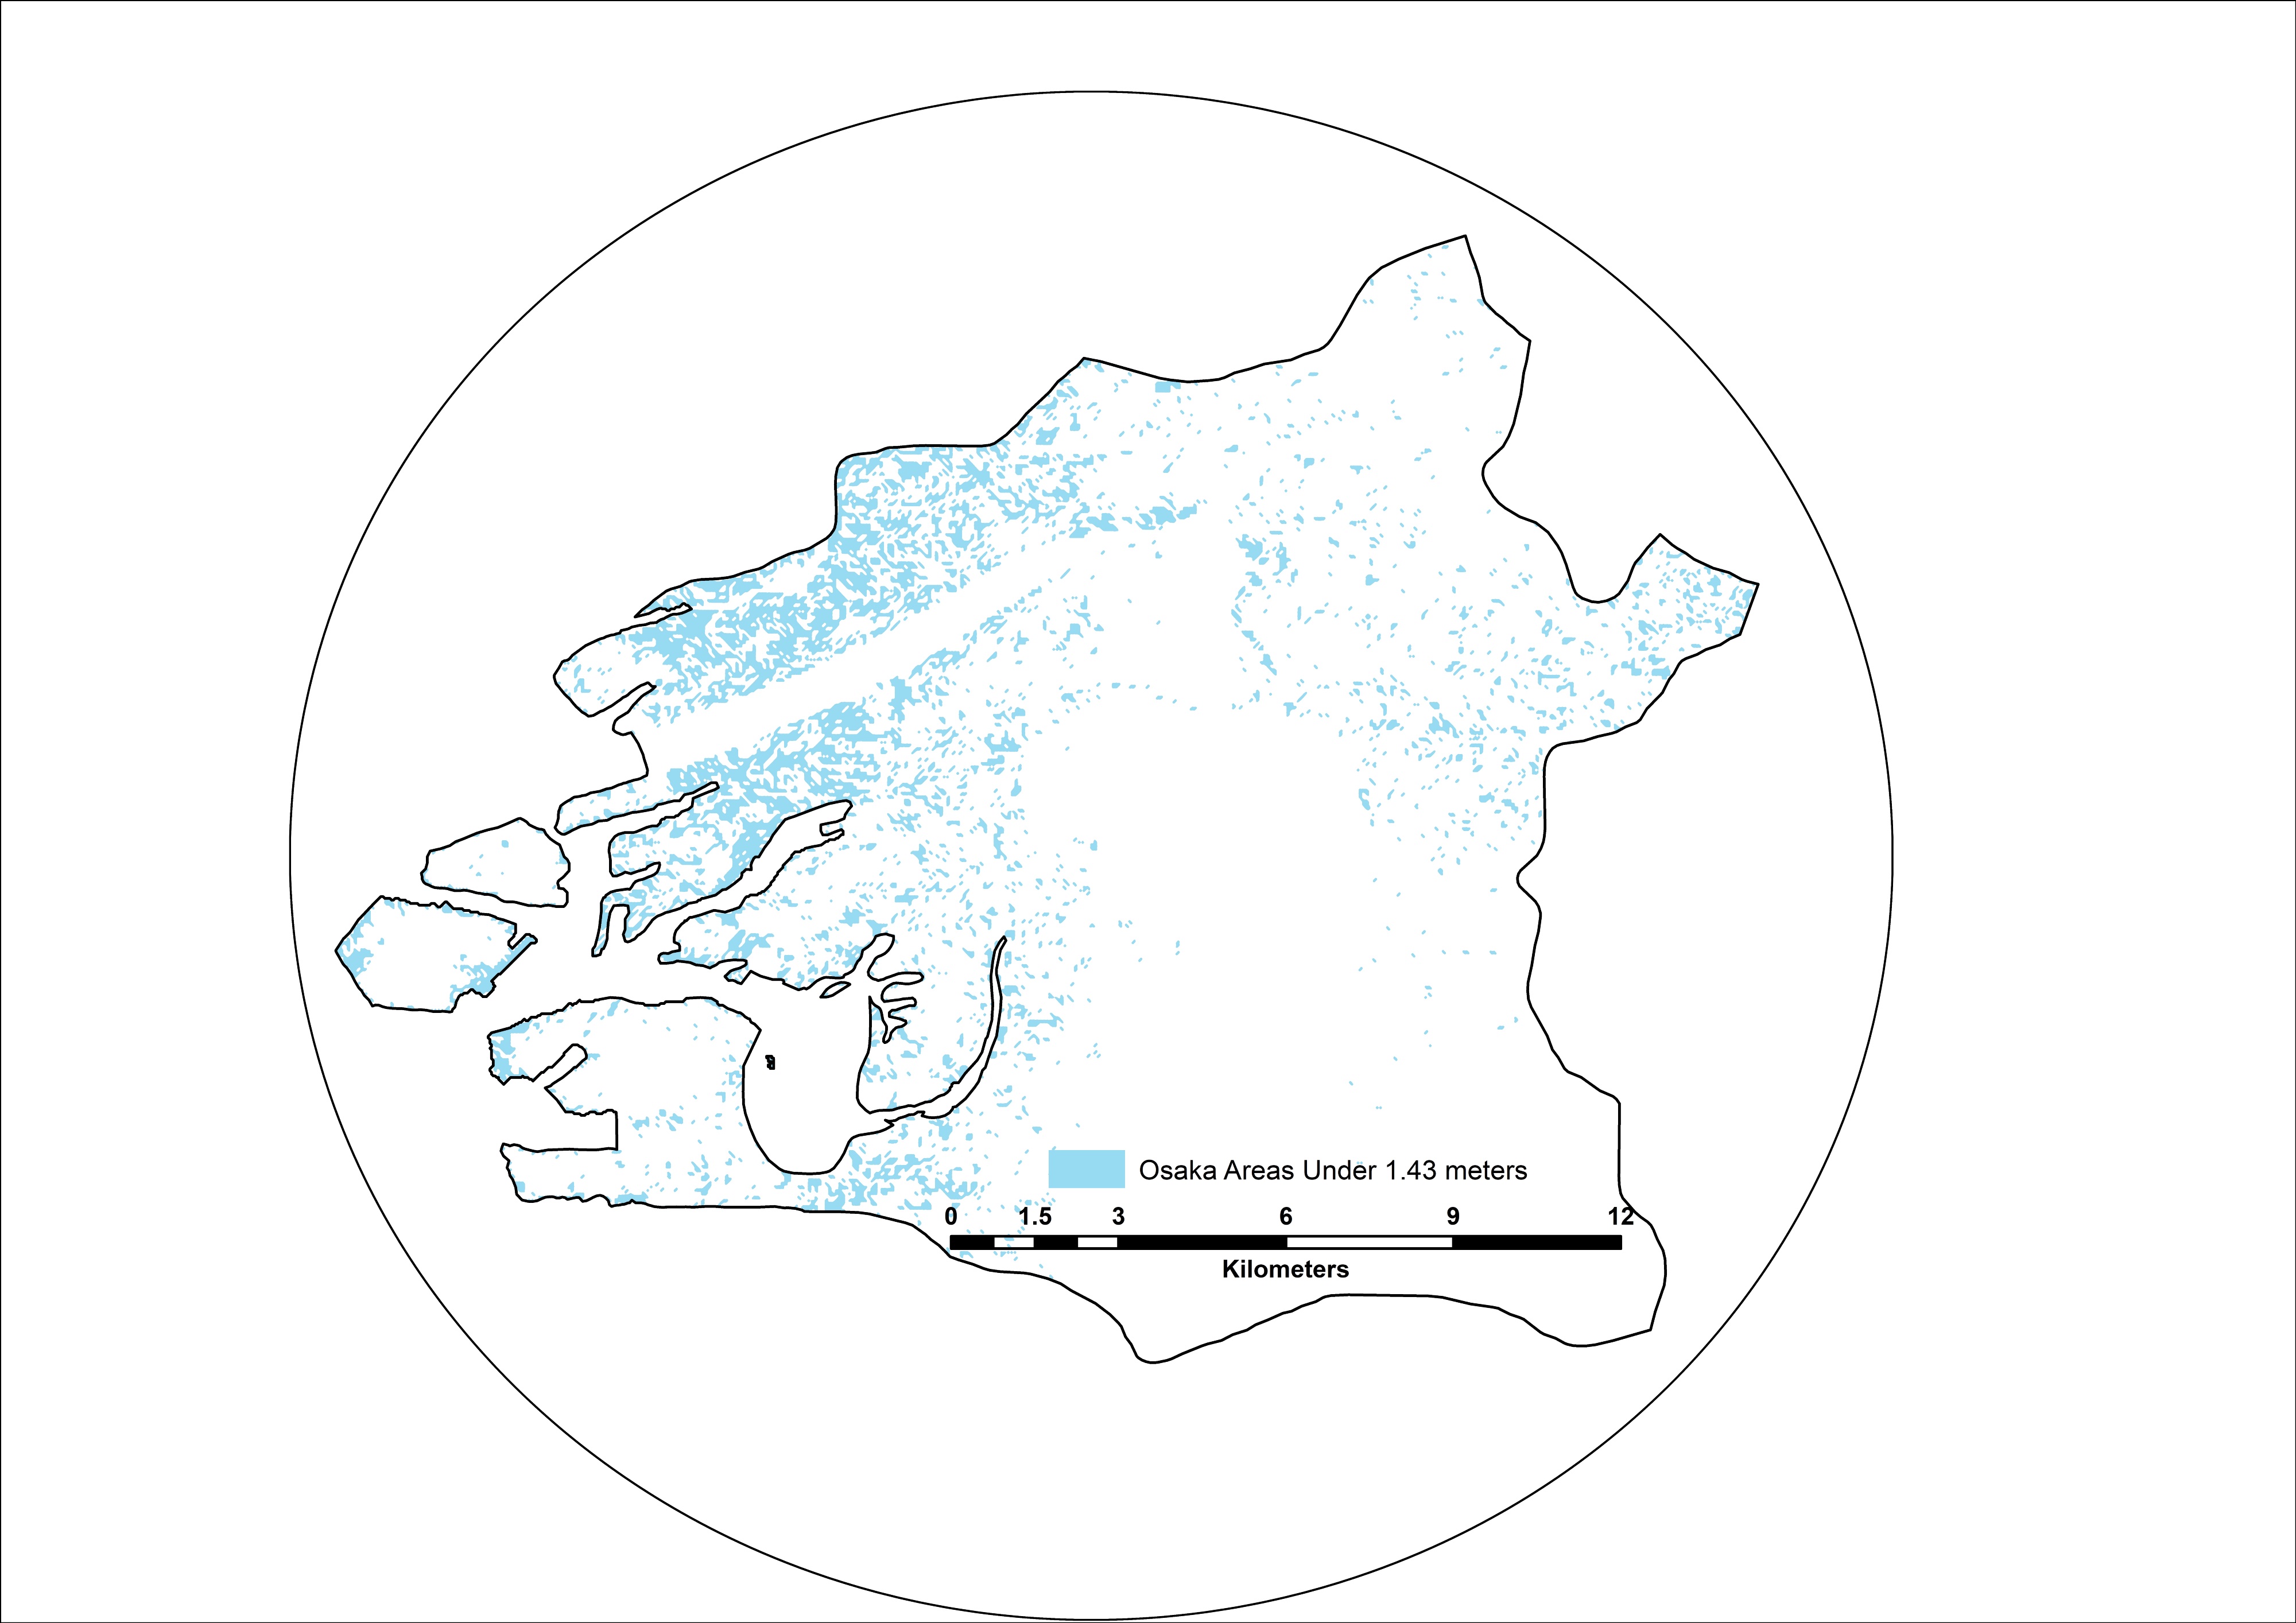
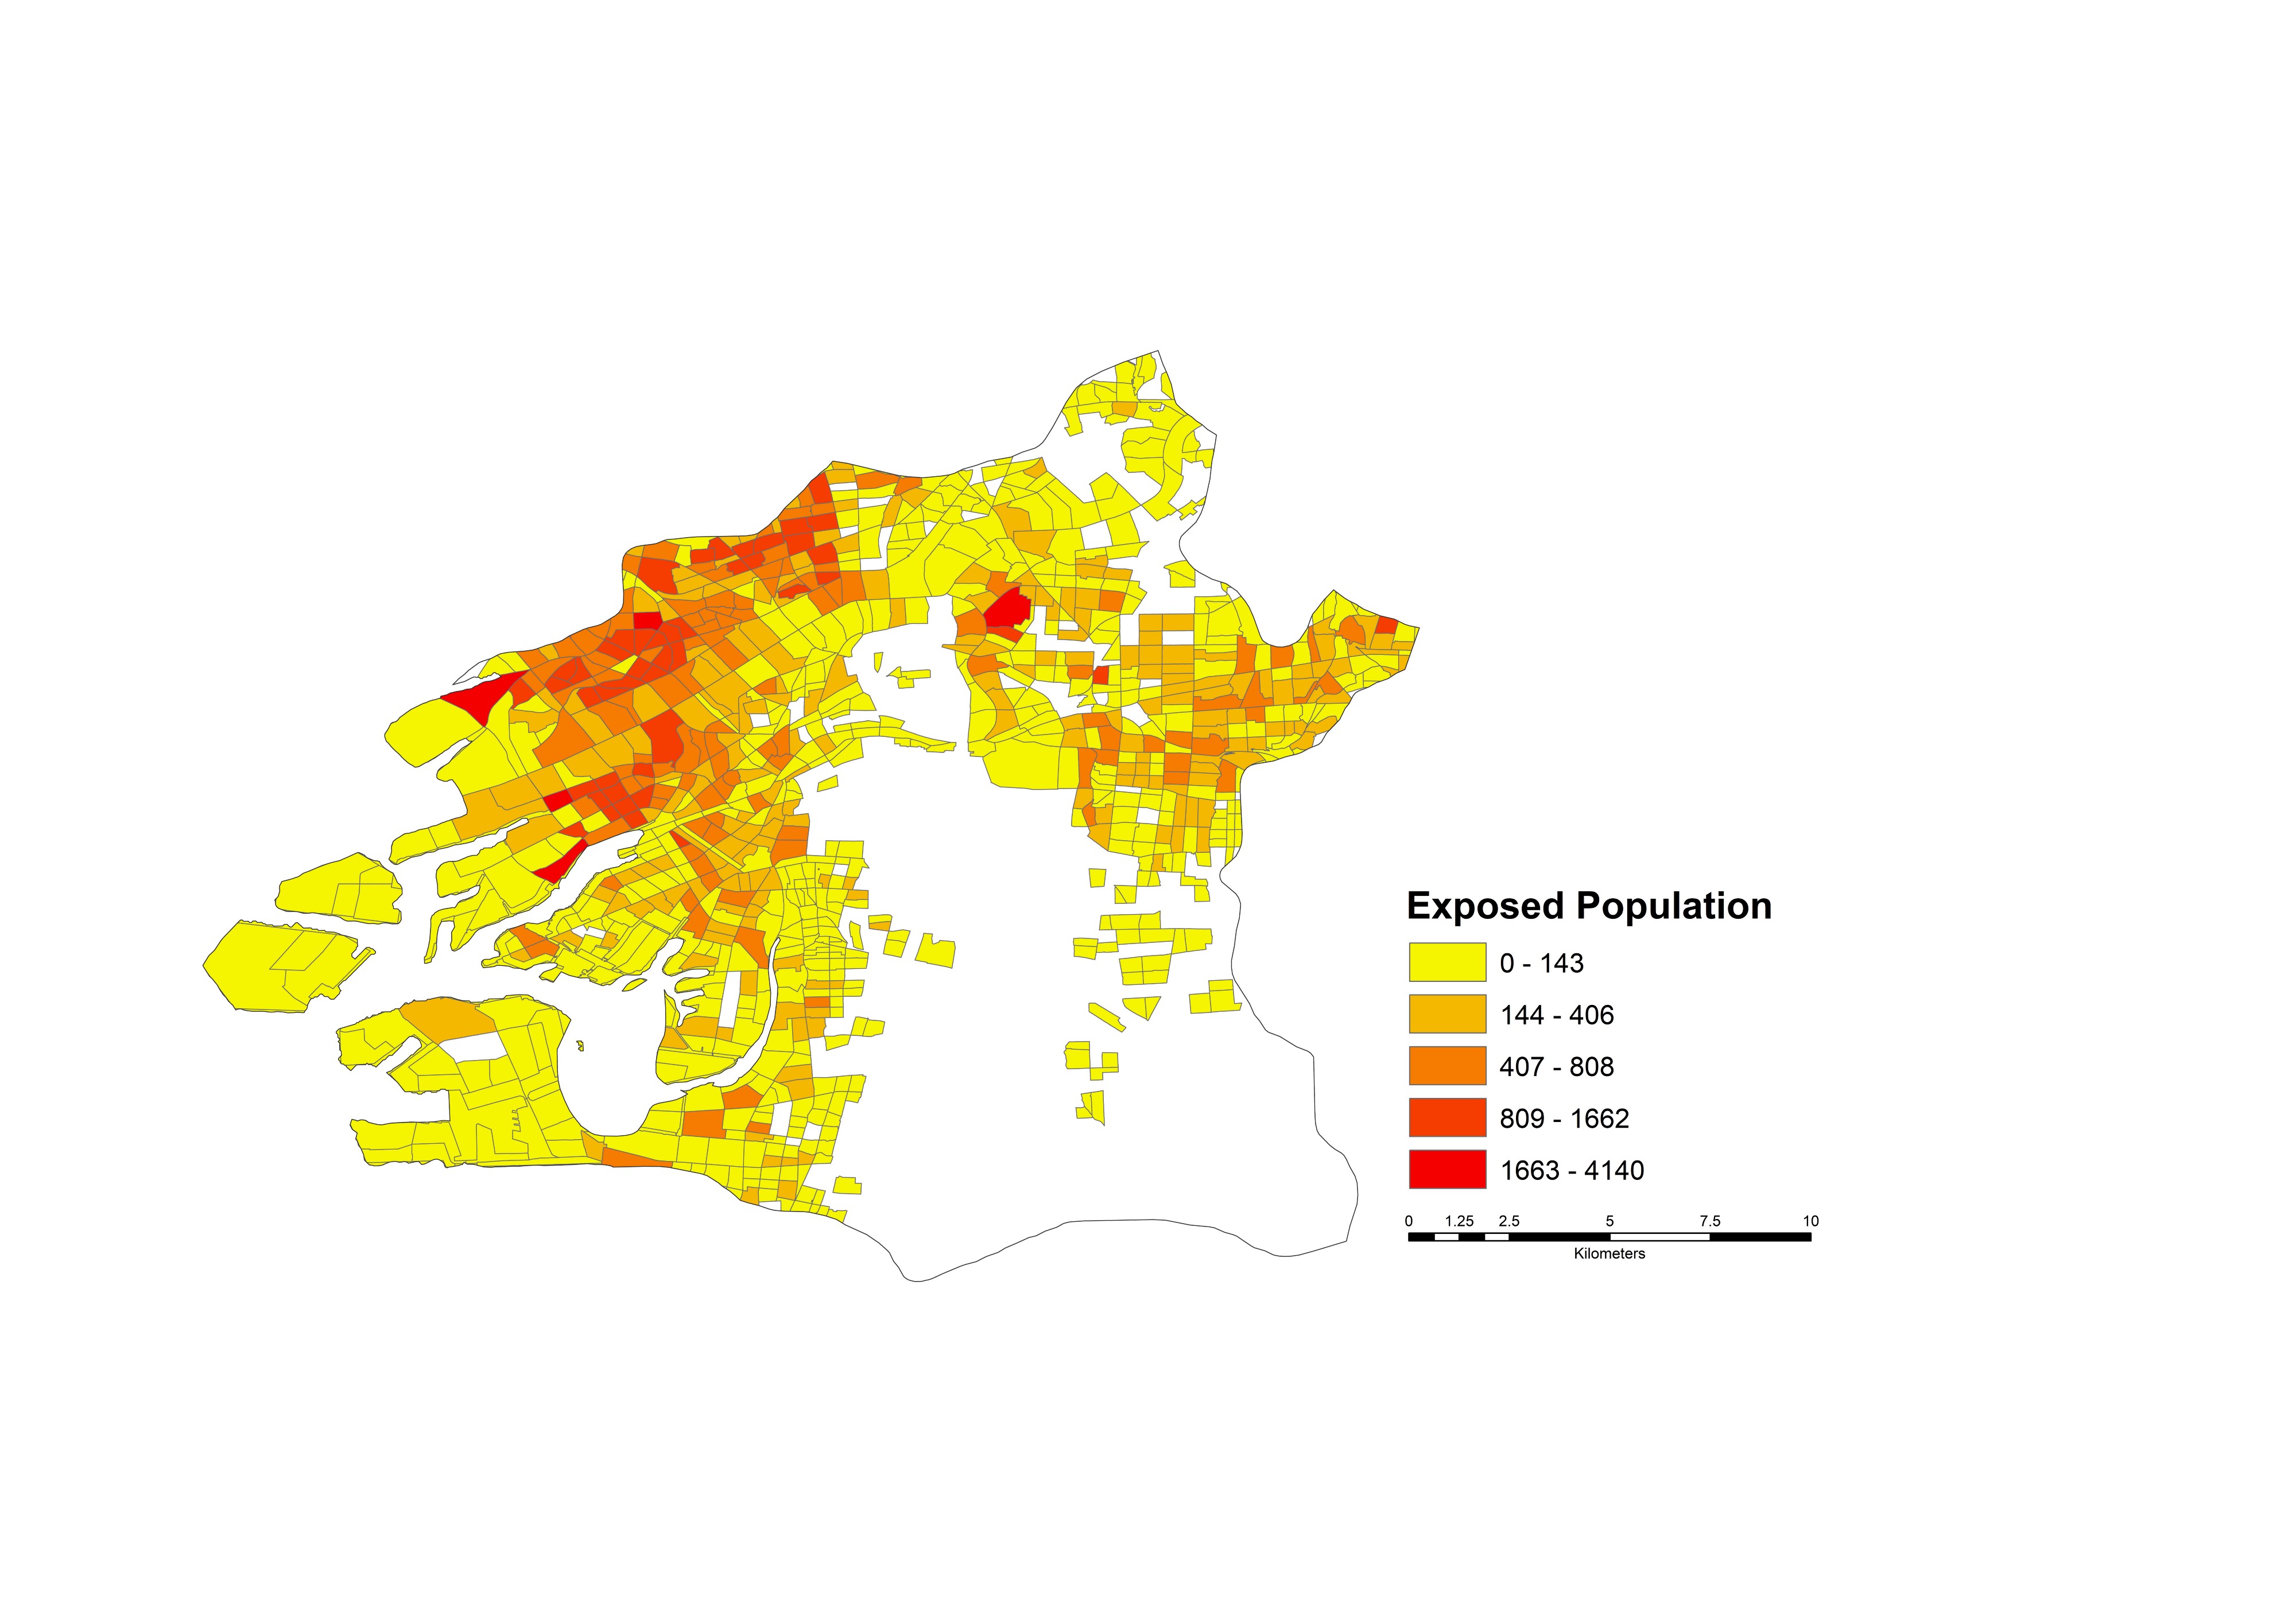
The calculations show that by 2100 an area about 24 km2 could be submerged in Osaka as a result of rising sea levels. 92% of the submerged areas would be urban areas where as 3% would be vegetated areas and 2% rice fields. Additional calculations reveal that 10% of the buildings could be exposed to flooding after the increase in sea level. This means that more than 210.000 people are estimated to be effected in this sea level rise scenario.
Discussion
The result for mean the sea level rise may change according to the data sources. For instance, although the report from World Bank (1996) indicated no land subsidence in Osaka, the Japanese Ministry of the Environment reported a subsidence about 1.4 cm/year (Ministry of Environment, 2005). The report is Japanese so I couldn’t entirely be sure.
The formula used in this project is simplistic and the accuracy seems low (considering IPCC report). The effects of defense systems like dikes and storm surge barriers should be considered for a future study. Moreover, to increase the accuracy, a coastal vulnerability index can be used to calculate the coastal vulnerability to sea level rise (Ramieri et al., 2011).
References
- EX Corporation. (1996). Japan’s experience in urban environmental management : Main Report (English) (Departmental Working Paper №17942). Washington, DC: World Bank.
- IPCC (2015) Climate change 2014: Synthesis Report. Geneva, Switzerland: Intergovernmental Panel on Climate Change.
- Japan Meteorological Agency. (2018). Sea level. Retrieved January 14, 2019, from https://www.data.jma.go.jp/gmd/kaiyou/english/sl_trend/ sea_level_around_japan.html
- Japan Oceanographic Data Center. (n.d.). Tide Data Search. Retrieved January 14, 2019, from http://jdoss1.jodc.go.jp/vpage/tide.html
- Ministry of Environment. (2005). Overview of Ground Subsidence in Japan in FY 2005. Ministry of Environment. Retrieved from https://www.env.go.jp/ press/7835.html
- Ramieri, E., Hartley, A., Barbanti, A., Duarte Santos, F., Gomes, A., Hilden, M.(2011). Methods for assessing coastal vulnerability to climate change (ETC CCA Technical Paper). European Environment Agency. Retrieved from https://climate-adapt.eea.europa.eu/metadata/tools/ coastal-vulnerability-index-2013-cvi