
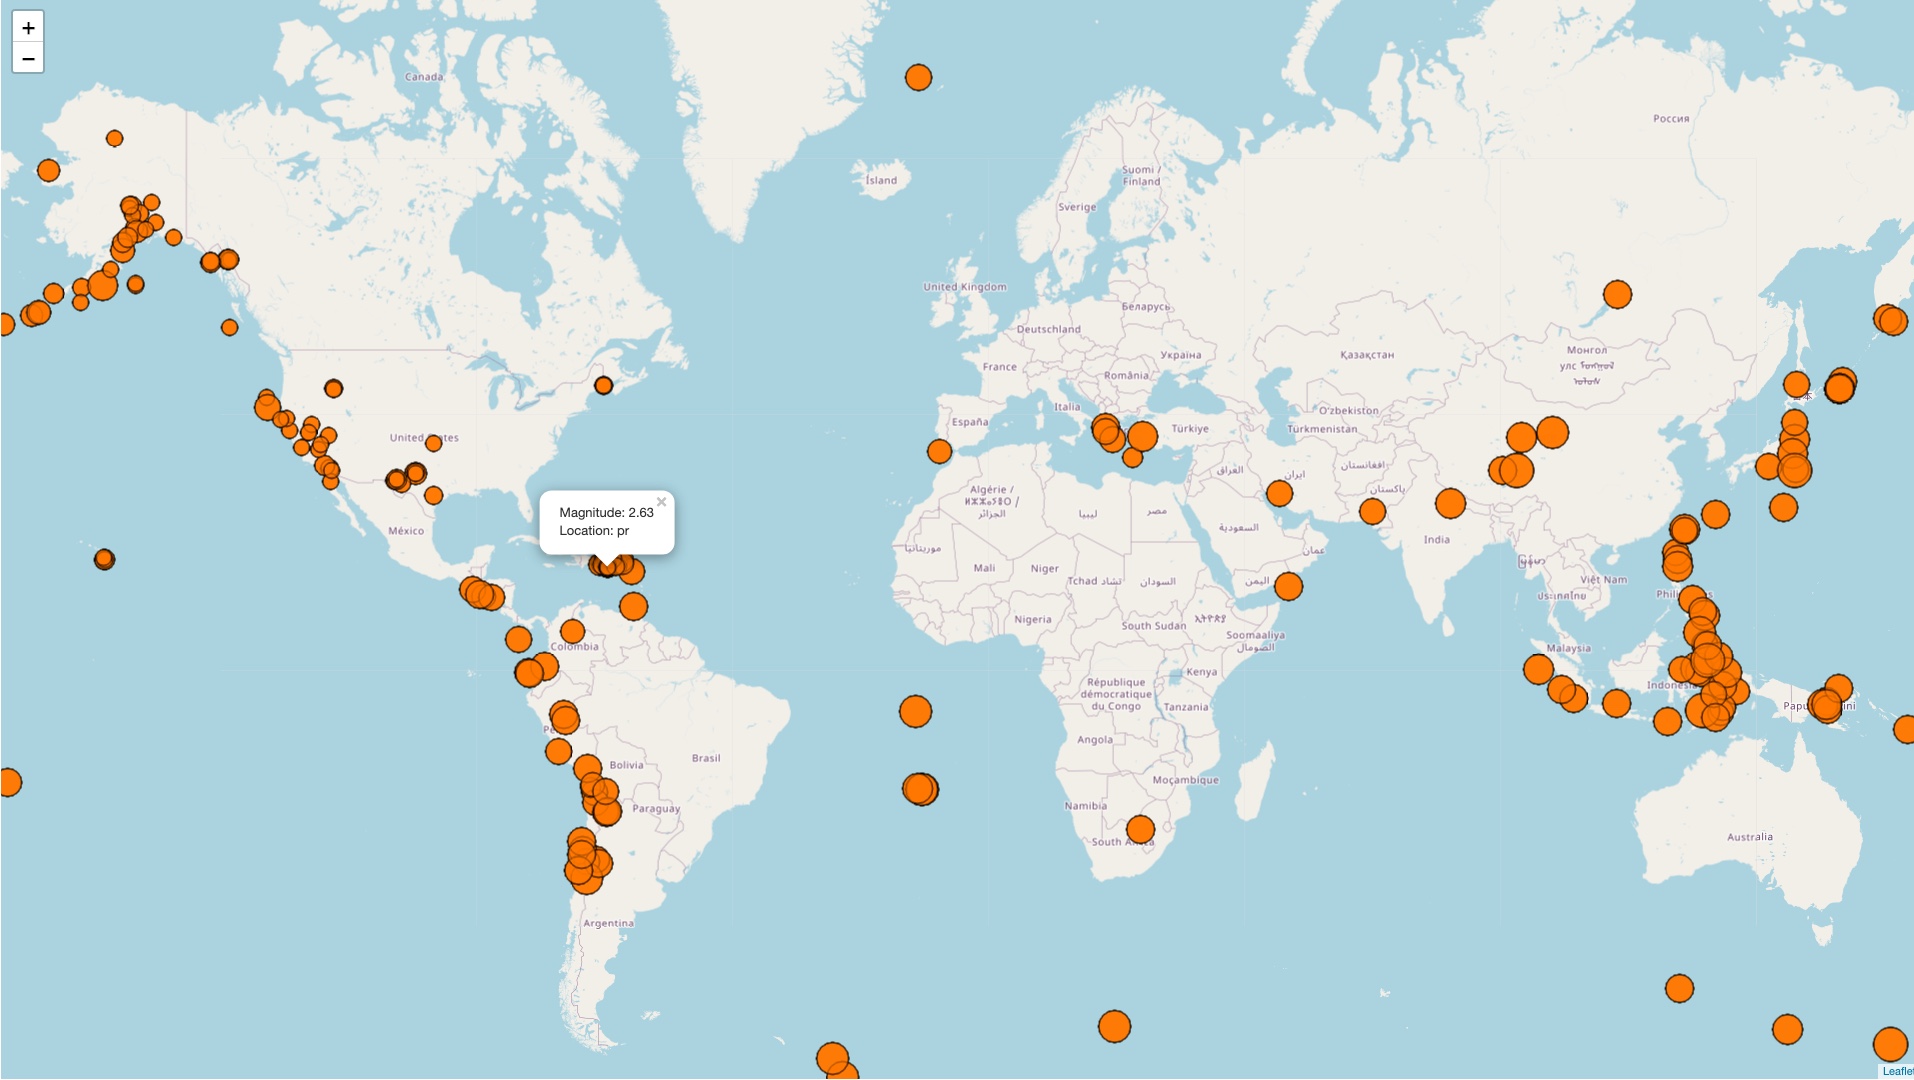
Being trained as a GIS analyst, I can see the advantages of acquiring web development skills. So, last week I decided to create my very first interactive web map with Django, Leaflet and PostGIS. In the clickable map you can display information in the popups and the marker size is dependent on the earthquake magnitude.
In this jupyter notebook you can see the steps I followed and all the notes I took in order to understand the process of :
- Downloading and activating PostgreSQL and PostGIS
- Creating a Django web app
- Uploading an excel file to the server
- Displaying this data on a map
- Adding popup on the markers
- Styling the map marker
- Change icon style to circle
- Display the circle size dependent on earthquake magnitude
This was tremendously fun and I can see that I have a long way to go. I would like to repeat a similar project to understand all the steps and how all the components are connected to each other.
If you are curious here is the github page for this project