
Software used in this project:
- ENVI for atmospheric correction
- SNAP for Sentinel 2 analysis
- ArcMap for NDVI analysis
I recently finished my master’s programme in Geomatics with Remote Sensing and GIS. I don’t think I would be exaggerating if I say that it was the best times of my life.
This was on of the many projects I did for the course “Applied remote sensing and GIS for landscape analysis” on 2018. I wanted to see how different methods impacted the natural hazard quantification. Now I can see how I could have improved this project.
- It would have been better to focus on a single method to go deeper in to the theory
- To analyse a natural disaster event which had ground truth data for the damaged areas. This way I could have computed accuracy of each method.
I’m not going to share all the details. Here are some of my notes from this project.
Change Detection Methods
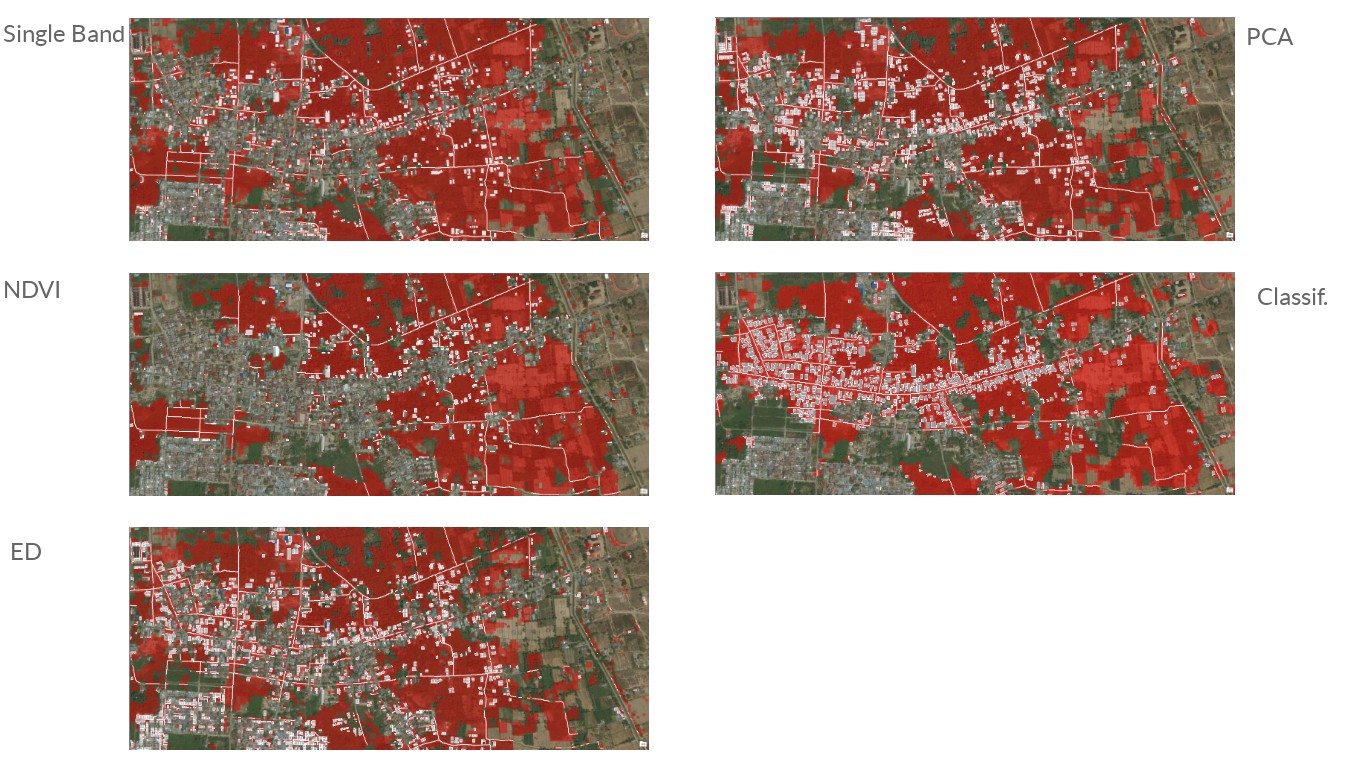
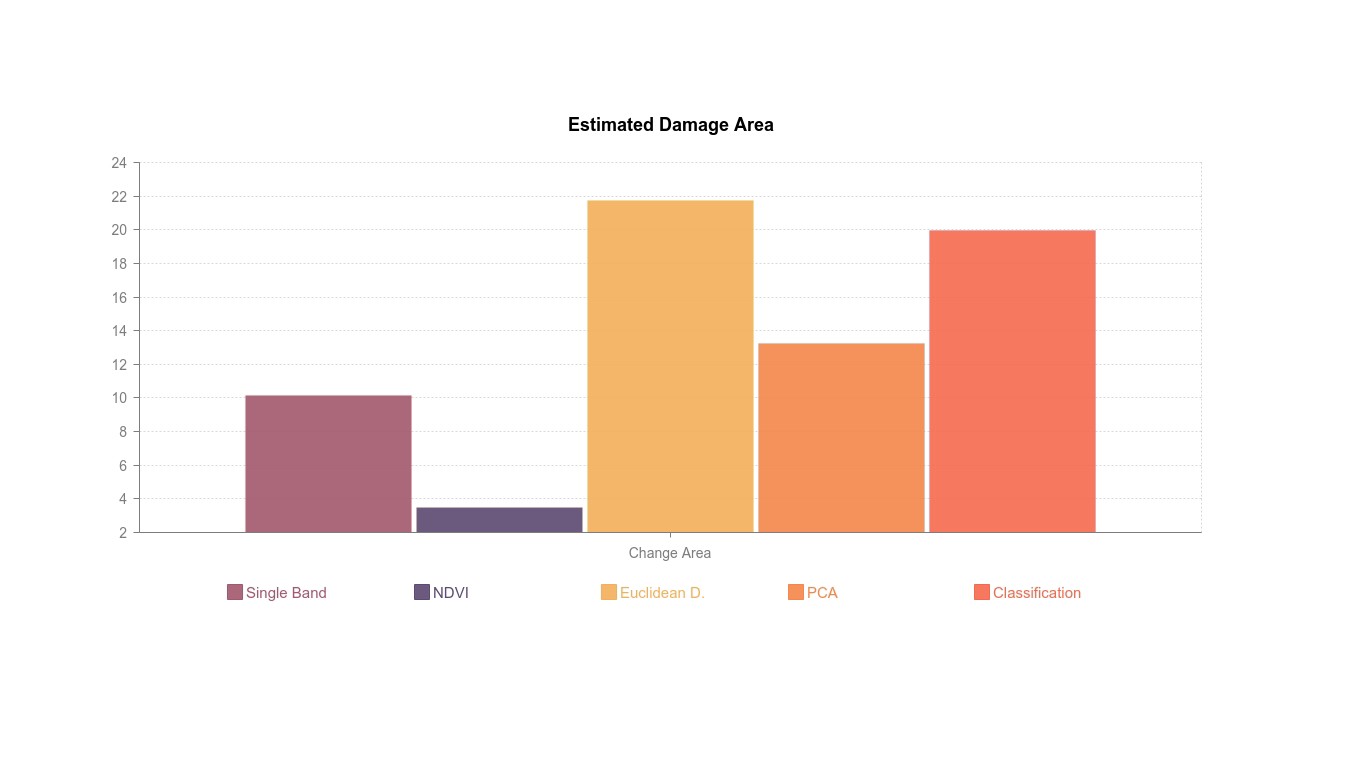
The aim of my project is to implement and compare different change detection techniques to see how they perform compared to each other in highlighting and quantifying the damaged area. We can divide change detection in remote sensing into five groups (Mouat, Mahin, & Lancaster, 1993). During the this time I had an opportunity to try and compare four groups and in total six different change detection techniques that are;
- Visual interpretation
- True color comparison
- Image Algebra (difference and ratio images)
- Single Band
- NDVI
- Euclidean Distance
- Transformation and data reduction
- PCA
- Classification
- Supervised Classification
- Statistical (This method was kept outside the study scope due to time limit)
As the essence of change detection is to compare pixels from before and after images the following preprocessing steps are very important (Campbell & Wynne, 2011). The images should be; - Acquired by the same sensor - Acquired during the same season - Well co registered - Free of clouds - Atmospherically corrected
Study Area 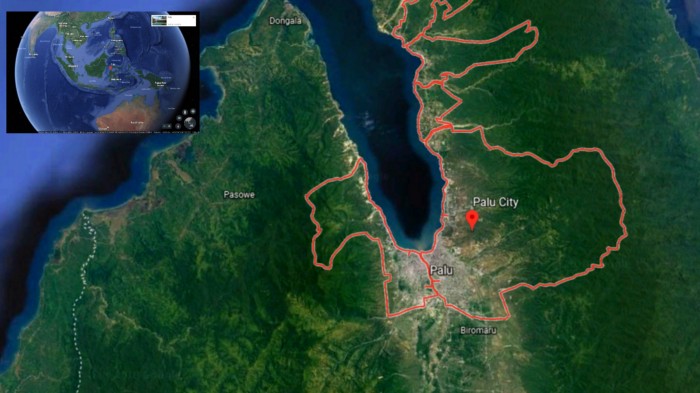
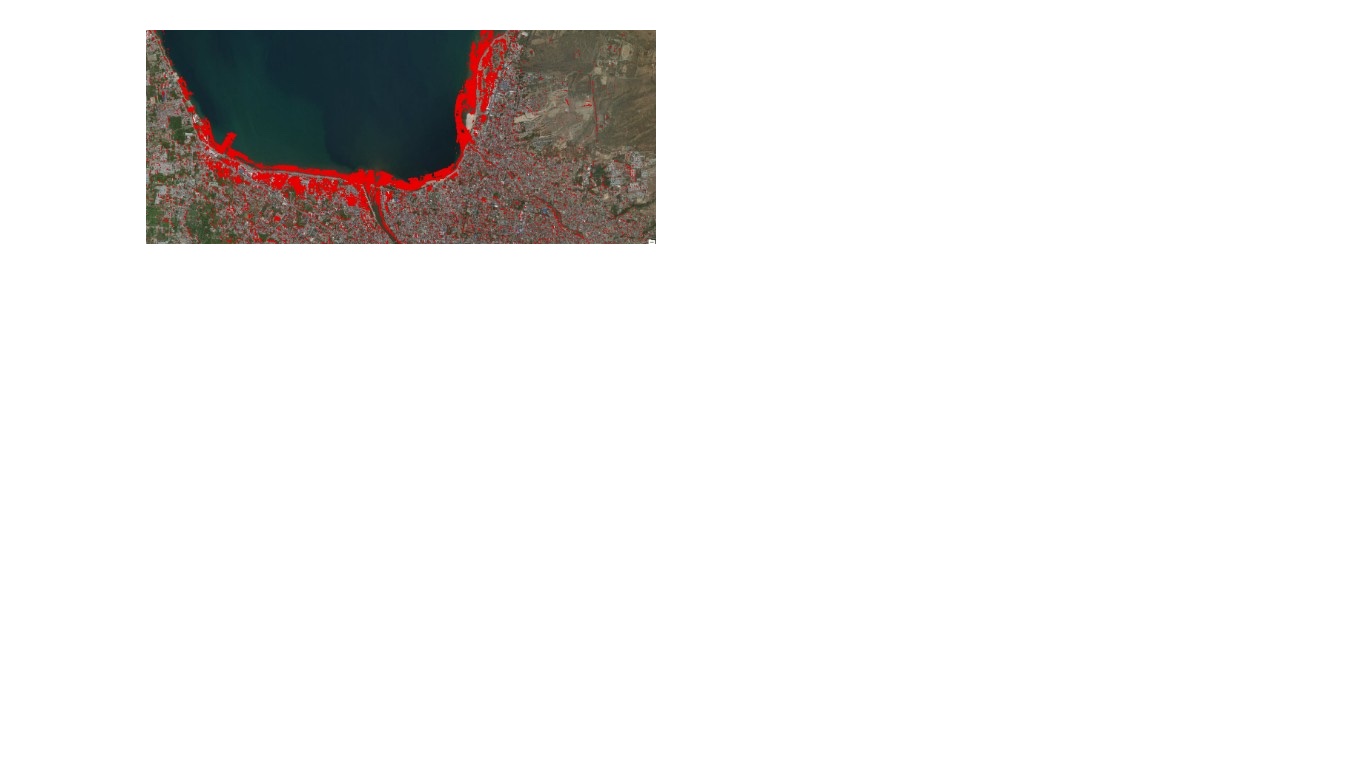
My study area is Palu city, on the Indonesian island of Sulawesi, where a tsunami struck right after the earthquake on September 28, 2018. I used two radiometrically corrected Sentinel 2 Level 1C images (“User Guides Sentinel-2” n.d.). I used ENVI to do the atmospheric correction.
Project Workflow 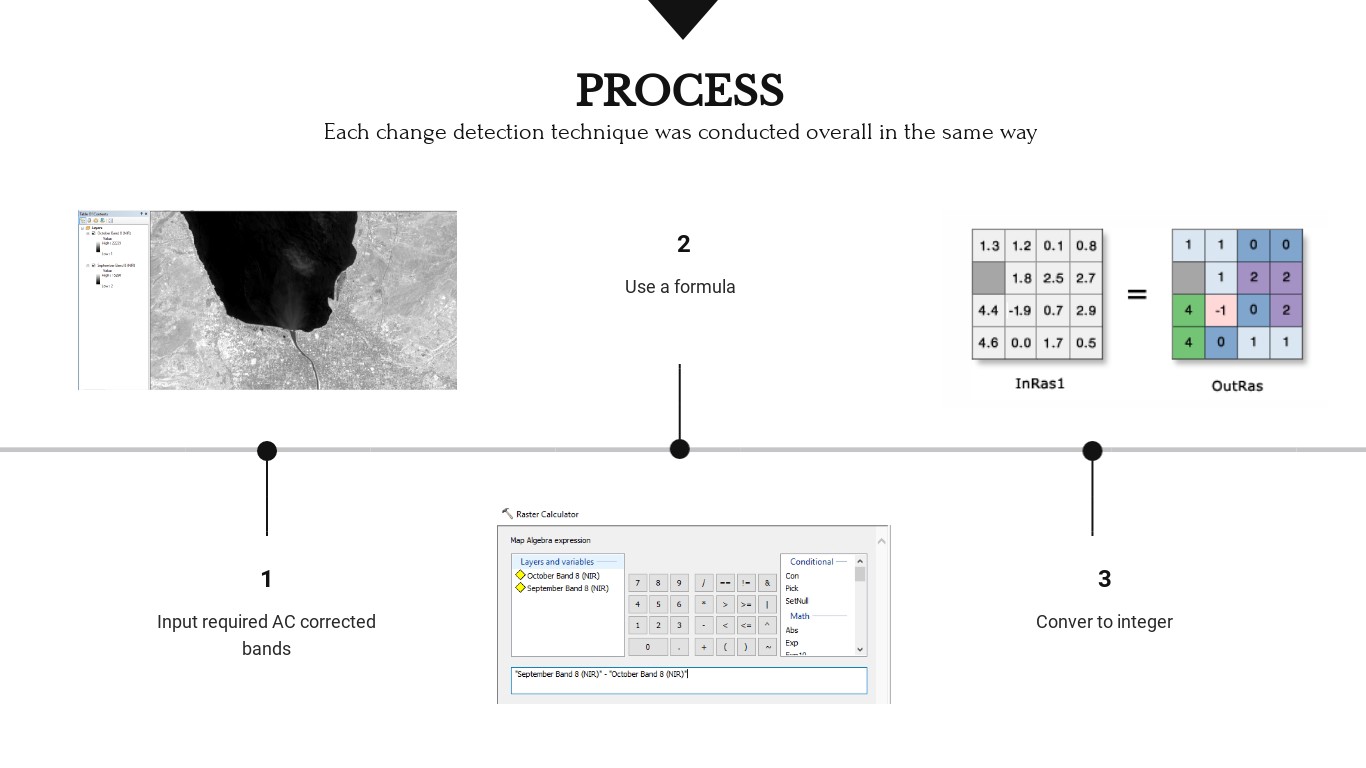
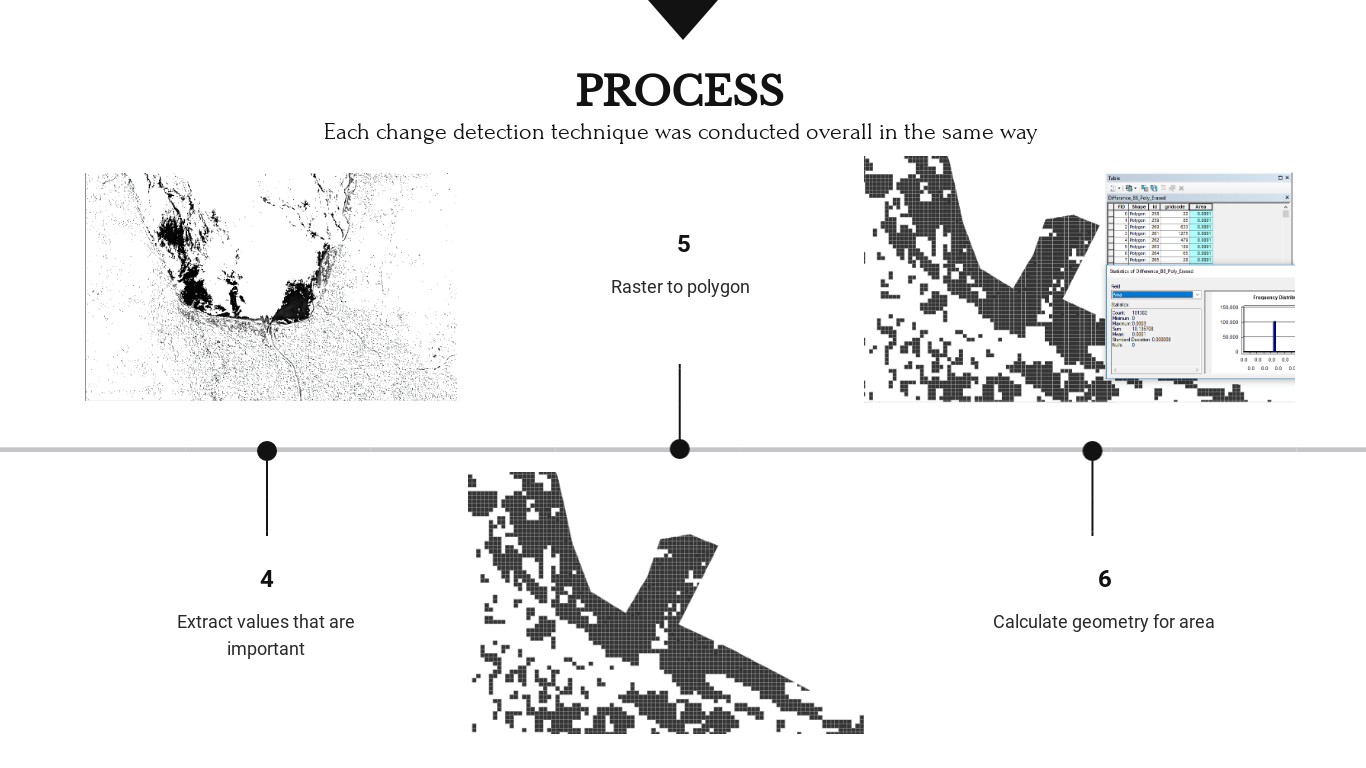
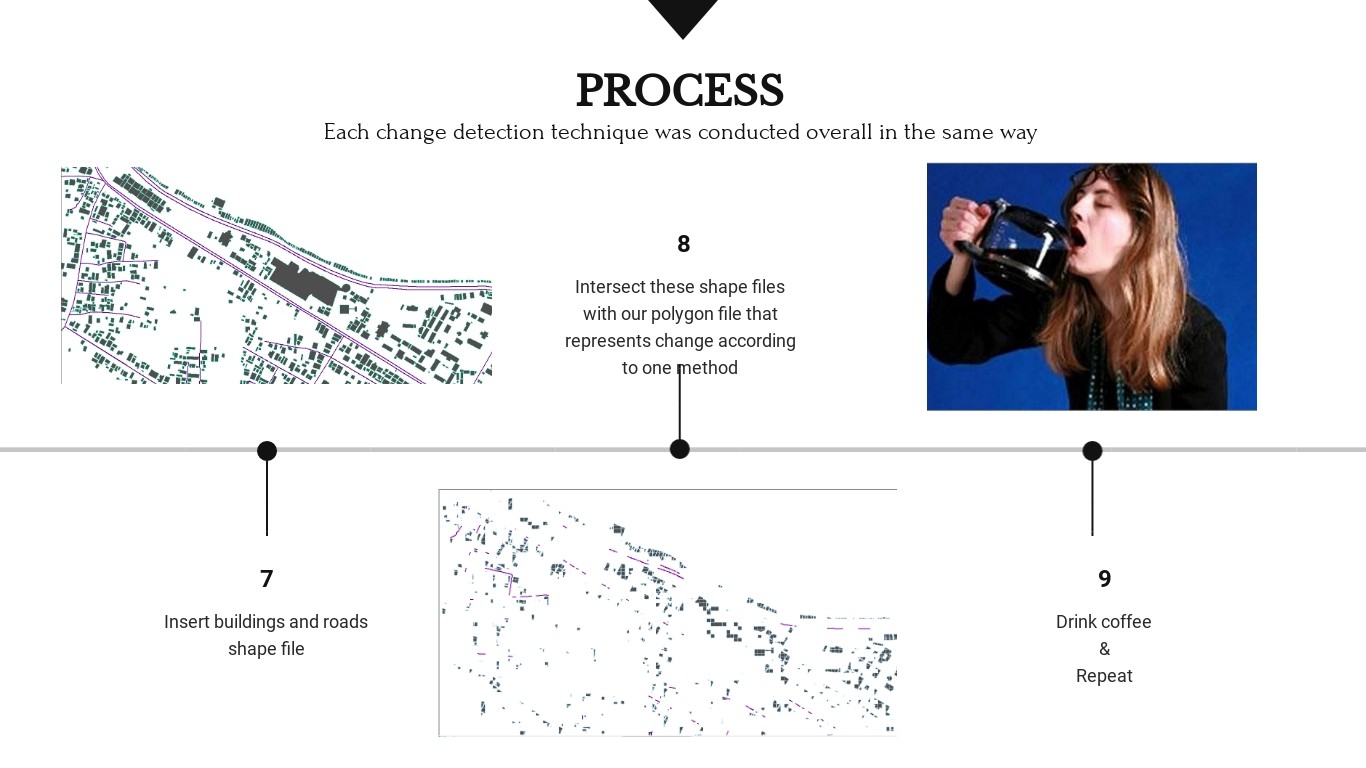 The workflow has eight steps. In the end by intersecting the results from the change detection techniques with the road and building shapefiles (step 8), I’m trying to quantify the post tsunami-earthquake hazard.
Troubleshooting // Discoveries
Sen2cor plugin in SNAP was buggy.
The automatically & manually calculated NDVI values in ArcMap were different.
I realised a pixel shift between September and October images.
Results 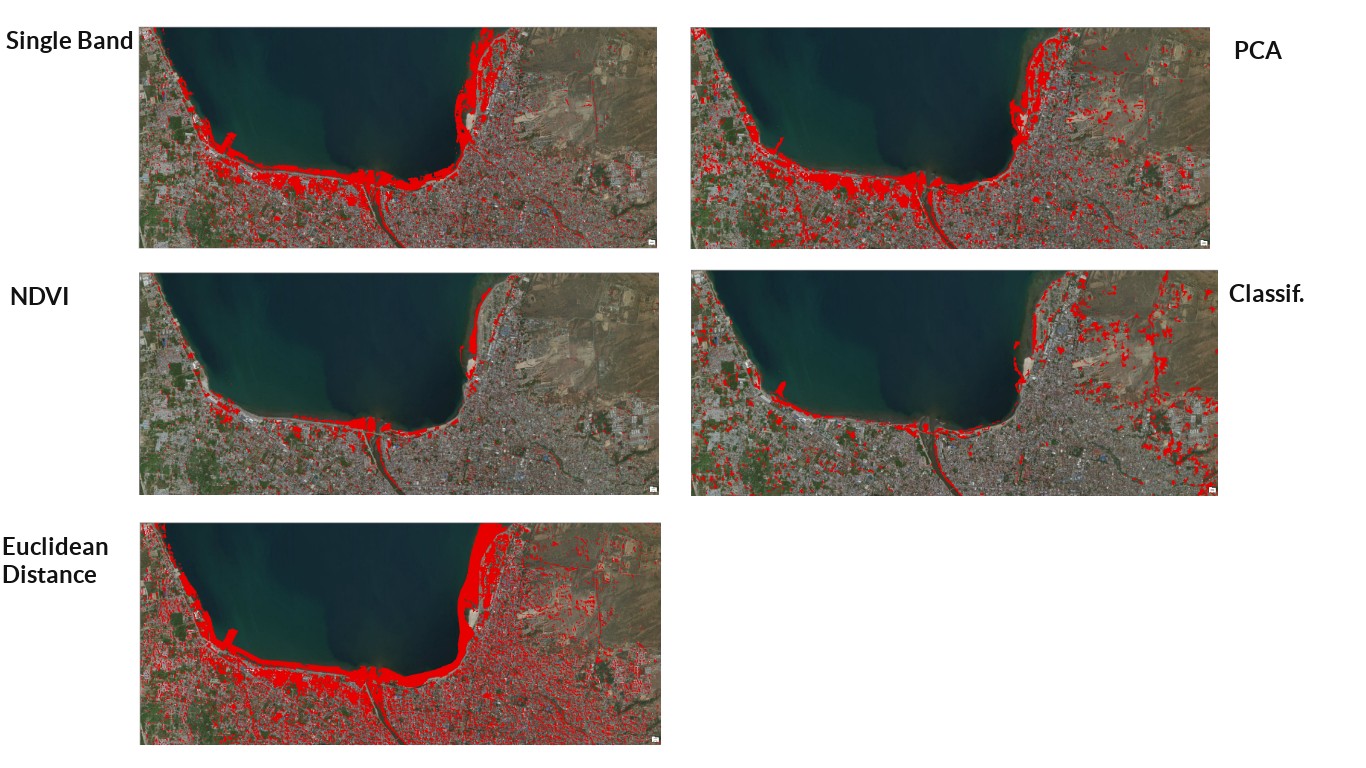
 References
- Campbell, J. B., & Wynne, R. H. (2011). Introduction to Remote Sensing, Fifth Edition. Guilford Press.
- Mouat, D. A., Mahin, G. G., & Lancaster, J. (1993). Remote sensing techniques in the analysis of change detection. Geocarto International, 8(2), 39–50. https://doi.org/10.1080/10106049309354407
- User Guides Sentinel-2. (n.d.). Retrieved November 4, 2018, from https://sentinel.esa.int/web/sentinel/user-guides/sentinel-2-msi/processing-levels/level-1